Unlike Hartford’s revenue profile, the City’s spending priorities tend to be in line with other cities and towns in the state.
Data for this analysis comes from the Comprehensive Annual Financial Report (CAFR) for the fiscal year ending in June 2013, which is the most recent audited financials available. Figure IV on page 15 of the CAFR breaks down City expenditures by category.
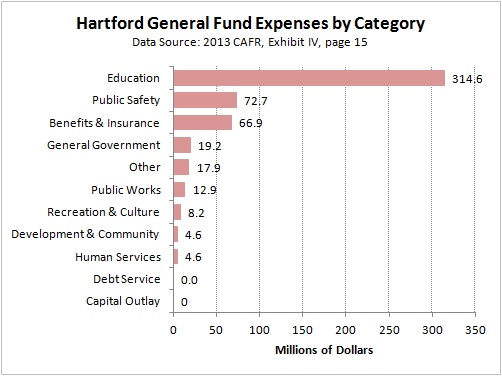
Focusing first on the $521 million in General Fund expenses, Education received the largest allocation, about 60%, while Public Safety and Benefits & Insurance were the only other two categories that received more than $20 million for the year.
Hartford had a meaningful amount of revenue and expenses outside of the General Fund. Performing the same analysis on the Total Governmental Funds column, which shows $941 million in expenses, changed the distribution of spending.
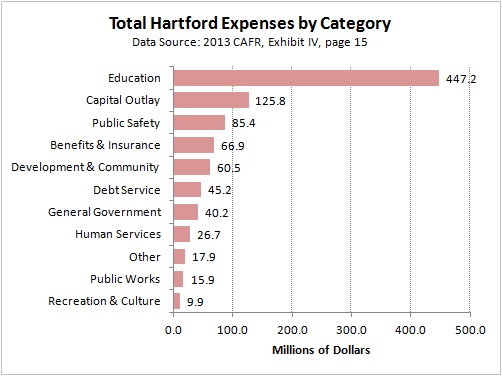
Education continued to be the largest allocation, though it fell to about 47.5%. Capital Outlay, which was mostly spending by the Capital Improvement Fund was the second largest allocation at $125 million. Public Safety spending was augmented by spending outside the General Fund, while Benefits & Insurance received no additional contributions.