The City of Hartford has a revenue structure that is different from most other municipalities.
Like most towns and cities, funding for City activities comes from three primary sources; residents, businesses and other levels of government. Audited financial statements, and assessor data, allow a more detailed look at Hartford’s revenue base. Consider the fiscal year ending in June 2013, the most recent year for which audited financials are available.
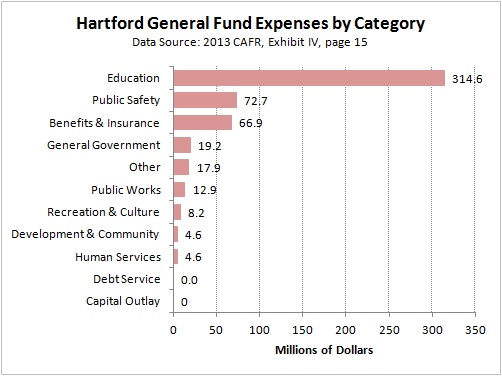
Most of the data in this analysis comes from Exhibit IV on page 15 of the 2013 Hartford Comprehensive Annual Financial Report (CAFR).
That year’s General Fund expenses were finalized at about $521 million. The corresponding revenue from Hartford taxpayers was about $256 million. Therefore, Hartford taxpayers funded about 49% of the City’s (General Fund) expenses. Most of the remaining revenue came from the State and Federal governments, accounting for $281 million and nearly 54% of General Fund expenses.
Looking deeper into the numbers, the revenue can be allocated to the different types of tax payers. Revenue from the State and Federal governments come from State and Federal Taxpayers. Revenue from the property tax comes from the residents and businesses within Hartford.
Data from the City Assessor’s office shows that Residential real estate owners made up 21.1% of the net assessments, Commercial real estate owners about 51.8%, Personal Property (business equipment) owners about 18.7% and Motor Vehicle owners about 8.5%. These figures take into account the City’s split assessment ratio.
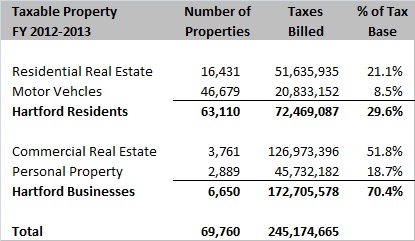
It seems logical to combine Residential Property owners and Motor Vehicle owners into a group called “Hartford Residents” that was responsible for 29.6% of the property taxes. It also seems logical to combine Commercial Property owners and Personal Property owners into a group called “Hartford Businesses” that was responsible for 70.4% of the property taxes.
During the fiscal year that ended in June 2013, the three taxpayer groups contributed to the City’s General Fund expenses as follows.
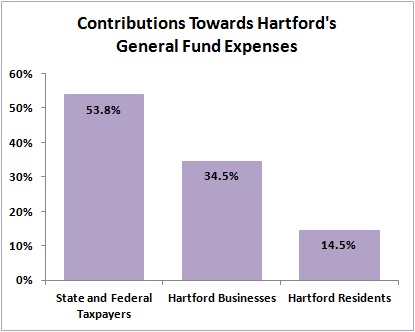
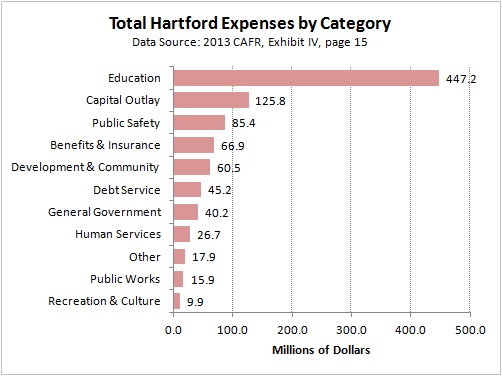
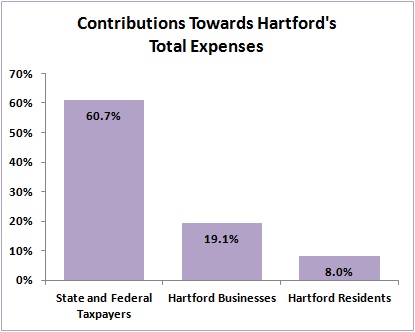
Exhibit IV on page 15 of the CAFR also shows that the City received an additional $290 million from the State and Federal governments outside of the General Fund. Repeating the calculation using the “Total Governmental Funds” instead of the “General Fund” changes the contribution percentages of each of the three groups.
In summary, the majority of Hartford’s revenue comes from State and Federal taxpayers. Hartford Businesses are the second largest funding contributor, followed by Hartford Residents. The breakdown of revenue sources is important to understand when evaluating the persistent budget deficit and working to restructure City government.
Note: The total in the “General Fund” calculation adds up to more than 100% of expenses because the General Fund showed a surplus during the fiscal year. The total in the “Total Governmental Funds” calculation is less than 100% both because there was a deficit and because of other smaller revenue sources.