Aspiring Mayors and the 2016 Hartford Budget

Let’s get excited everyone, it’s budget time in Hartford!

Like most recent years, the stage has been set with a large budget gap to overcome. Unlike previous years, however, the landscape is different this spring.

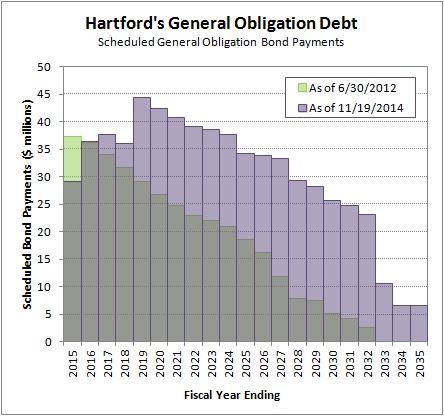
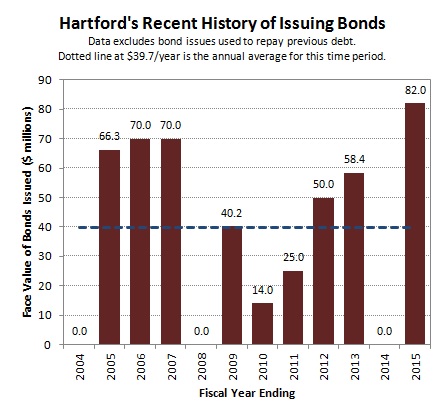
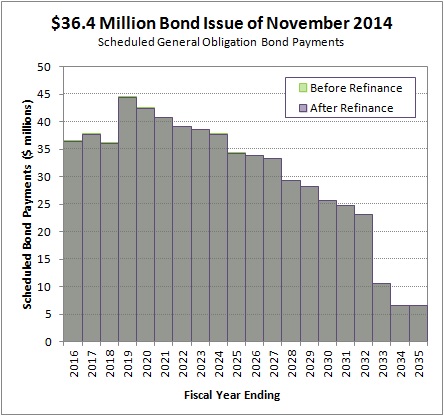
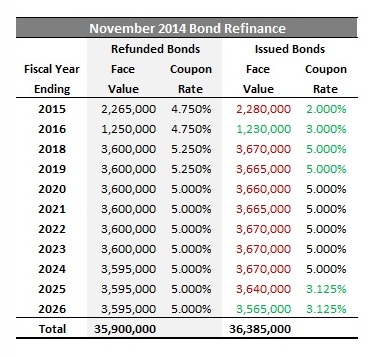
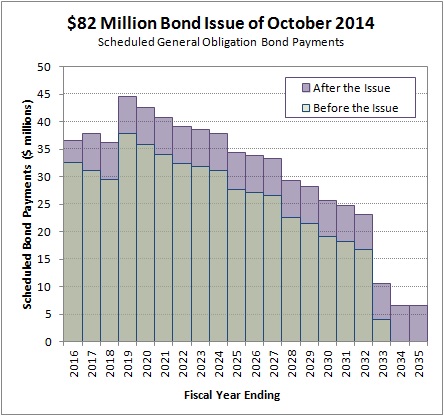
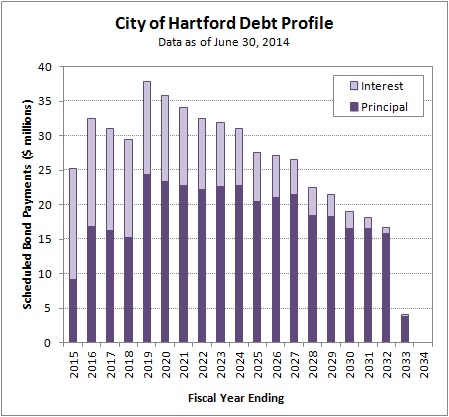
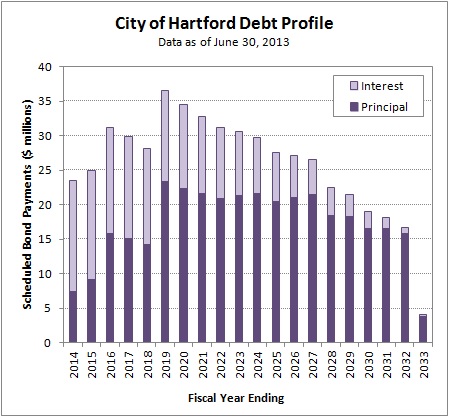
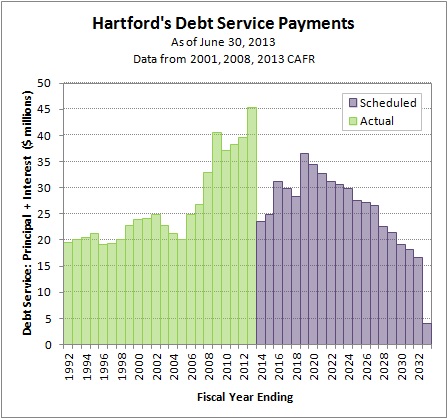
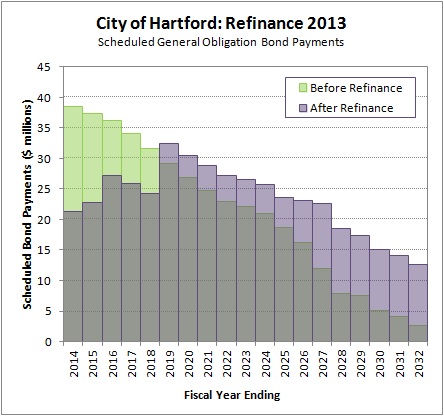
The effort to redevelop Downtown North generated considerable public debate about City finances. Hartford has continued to increase its general obligation debt, with rounds issued in October, November, and February (via the Stadium Authority) so far this fiscal year. Finally, phase one of the SC2 Challenge provided preliminary economic development ideas.

The Hartford Commission on the Restructuring of City Government met for the first time on January 5, 2015, after a six month delay. Meaningful recommendations are unlikely to be made in time for the current budget cycle, but could be available in future years.

This is also an election year; the residents will select the next Mayor in November. The race has already drawn a considerable amount of attention, and numerous potential candidates.

The Mayoral race could serve to elevate the budget debate. Serious candidates know that the City has an unsustainable financial model. They know that the City needs a new forward-looking vision.

This is an opportunity for candidates with legitimate ideas to lead the conversation. Residents are poised for debate after months of discussing the Downtown North project, and the media has an apparently insatiable appetite for Hartford politics.

Hopefully the aspiring Mayoral candidates will engage in the budget discussion to bring new ideas to the table about how to move the City forward.

Hartford Can’t Borrow its Way to a Balanced Budget

Hartford’s elected leaders restructured the City’s debt in March 2013 in an attempt to address a structural budget gap. It was an effective way to address short-term concerns, but will ultimately be an expensive temporary measure as the bill comes due.

The chart below attempts to show graphically how scheduled debt payments were manipulated. It compares scheduled payments as of June 30, 2012 (green bars in the background) to scheduled payments after the November 2014 issue (purple bars in the foreground).

The color at the top of the bar indicates the direction of the change. A green top means the scheduled payment was higher as of June 2012, while a purple top means the scheduled payment was higher as of November 2014.

2015-02-17 Evolution of the Hartford Debt Profile

The Hartford Citizen’s model estimated that Hartford owed about $29 million in the current fiscal year (fiscal 2015). This total is over $8 million less than the City was scheduled to owe as of June 2012. The decrease illustrates the impact of the restructuring.

While arguably an effective short-term strategy for balancing the budget, postponing debt into the future is a poor long-term strategy. The debt will ultimately need to be repaid, with interest.

If a balanced budget depends on annual debt service costs of about $29 million, then what will that mean for the future? Debt service payments are projected to remain above this year’s $29 million level until 2028. They are projected to peak at $44 million in 2019.

Since fiscal 2004, the City has averaged $39.4 million in new debt issued per year. It is highly unlikely that Hartford will stop issuing debt altogether in order to pay down the current balance.

The chart below shows the year-by-year totals, and excludes debt used to restructure or refinance. So far this year (fiscal 2015), Hartford has issued $82 million in debt, more than double the average of the 2004 to 2015 time period.

2015-02-17 Recent History of Bond Issues

When a person, or a company, or a municipality borrows money, they need to have a plan pay it back. Money is not free.

Borrowing money can delay expenses, but it cannot reduce them. Loans are not a long-term solution to a structural budget gap. Additional debt will make a persistent budget deficit worse.

How do the City’s elected officials plan to pay back the money Hartford already owes?

$36.4 Million Bond Issue of November 2014

Shortly after issuing $82 million of bonds in October of 2014, the City brought another round of debt to market in November of 2014.

Hartford raised $40.5 million total, with a face value of $36.4 million and premium of $4.1 million. The purpose of the issue was to refinance previous debt, and the Official Statement noted specifically which existing bonds would be refunded.

In a press release that accompanied the two late 2014 issues, Treasurer Adam Cloud stated that the November 2014 issue was “expected to produce approximately $2 million in debt service savings.”

The chart below shows the impact of refinancing on the scheduled debt payments. Unlike the April 2013 restructuring, the before data (green) and after data (purple) line up almost exactly. There was no obvious impact of the refinancing at the big picture level.

2015-02-16 November 2014 Bond Issue

The table below compares the annual maturities side by side. The approach of this refinancing was to substitute new bonds of approximately the same face value, but with different coupon interest rates. Green font in the table signifies new issues with a more favorable term; either a lower face value or a lower coupon rate. Red font signifies a less favorable term for the new issue.

2015-02-16 Maturities in the November 2014 Bond Issue

The impact of the refinancing is difficult to calculate with precision. There is subjectivity in how to treat debt payments that extend more than a decade into the future. Treasurer Cloud felt the offering would save the City “approximately $2 million” over 12 years.

The Hartford Citizen’s analysis of Hartford’s General Obligation debt was performed using a spreadsheet created to match the information shown in the annual audits (Comprehensive Annual Financial Reports). The model estimated total debt service savings of about $1.2 million over 12 years.

The estimate included the additional $485,000 in principal payments added to the debt, and summed future cash flows without discounting them (which maximized the value of future savings). The estimate did not include the $327,000 in underwriting fees paid to the investment bankers, which would bring the estimated savings below $1 million.

$82 Million Bond Issue of October 2014

Hartford raised two rounds of General Obligation debt in the fourth quarter of calendar 2014.

The first round was in October, when the City raised $95.1 million in an issue with $82 million in face value and $13.1 million in premium. According to the Official Statement, the proceeds were earmarked for “various public improvement projects” and “the City’s portion of various school projects.”

A press release issued by Treasurer Adam Cloud about the pair of bond offerings stated that the City received “its lowest borrowing cost in decades” at an effective interest rate of 3.11%.

The chart below compares the City’s scheduled annual debt payments (principal plus interest) before and after the debt issue. The green bars in the foreground show the debt profile as of June 30, 2014, while the purple bars in the background show the debt profile as of October 31, 2014.

2015-02-15 October 2014 Bond Issue

The purple tops of the bars show the amount of this issue to be repaid in each fiscal year. Payments were extended by two years, and about $6.5 million in annual debt service was added to fiscal years 2017 through 2035. If the bonds were held to maturity, the City would repay $130.8 million over 20 years.

Hartford’s Long-Term Debt as of June 2014

As of June 30, 2014, the end of the City’s fiscal year, Hartford’s General Obligation debt included scheduled payments through the fiscal year ending in 2033.

2015-02-14 Debt Profile as of 2014-06-30

There was no public debt issued by the City during the fiscal year that ended in June of 2014. However, the projected debt payments have changed since the June 30, 2013 long-term debt analysis.

The 2014 Comprehensive Annual Financial Report (CAFR) shows a $10.25 million debt issue from March 2013 on the table on page 65 of the pdf.

That issue was not included in the June 30, 2013 analysis because it was not included in the 2013 CAFR.

The table on page 70 of the 2013 CAFR shows the $124.6 million March 2013 issue that Hartford used to restructure City debt. The table does not show the $10.25 million March 2013 issue. In addition, there is no public offering statement available on the EMMA website.

Hartford Treasurer Adam Cloud stated that the $10.25 million issue was a private placement with Bank of America that did “not require an official statement” on the EMMA website, and that the funds were used for “various capital projects.”

Note that the Comprehensive Annual Financial Report for 2014 shows both the refunding bonds and the refunded bonds from the $124.6 million 2013 debt restructuring. This overstates the amount of debt the City owes by over $100 million, making some of the CAFR’s tables and exhibits misleading. There is an accounting technicality involved that is explained in Note 8 on page 64 of the pdf.

Distribution of Residential Real Estate Taxes

Property taxes fund a meaningful part of Hartford’s budget. The City has a split tax system in which residential real estate is taxed at a lower rate than other property types.

Specifically, single-family homes, two-family homes, three-family homes, condominiums, and a couple other smaller property classes are assessed at about 30% of Market Value (as of Grand List 2013). The State standard assessment ratio used by all other Connecticut municipalities, and used for other property classes within the City, is 70% of Market Value.

Taxes = (Market Value) * (Assessment Ratio) * (Mill Rate/1,000)

For the current fiscal year, which utilizes Grand List 2013, a residential property with a market value of $150,000 will owe about $3,335 in annual taxes. The effective tax rate is about 2.2% of market value.

The City Assessor’s office provided data for all the real estate that qualifies for the reduced residential assessment ratio for Grand List 2013. Using this list, the current assessment ratio of 29.93%, and the current mill rate of 74.29, the annual taxes were calculated.

The chart below shows how the annual residential properties taxes were distributed. For example, there were 6,608 properties that owed between $3,000 and $3,999, which is shown as the “$3,000s” in the chart.

2015-01-27 Residential Property Tax Distribution

There were 17,126 residential properties in the dataset. The average annual bill was about $3,240 and the median annual bill was about $3,182.

Actually, That’s a Budget Conversation

The City’s financial position is rarely discussed directly. It’s not a sexy topic, and can be discouraging.

However, the restrictions it imposes influence all other decisions and priorities. Most discussions about Hartford’s goals are really conversations about the budget.

Want to improve the educational environment for the City’s children? Great, figure out how to fund the changes.

Hope to improve public safety? Super, let’s look at what that might cost.

Plan to encourage job creation within the City? Excellent idea, though don’t overlook the impact of the mill rate on commercial property owners.

Hartford cannot make meaningful and sustained progress on any issues without first addressing the budget.

First Restructuring Committee Meeting

City of Hartford COO Darrell Hill convened the first meeting of the Hartford Committee on the Restructuring of City Government on the afternoon of Monday, January 5, 2015.

Nine of the twelve committee members attended at least a portion of the meeting. There appeared to be some membership changes since the initial appointments. The gathering focused on background information and the committee’s overall mission.

Mr. Hill noted that the Committee was originally expected to start in July of 2014 and deliver final recommendations in December 2014. He said that he still envisioned a six month effort, though recognized that major recommendations were unlikely to be approved in time for the City budget cycle that is about to begin.

Preliminary documents distributed to committee members estimated a $40.4 million budget gap for the coming fiscal year. Committee member Albert Ilg stated that he recalled a $25 million goal when the resolution establishing the committee was passed in the spring of 2014. Mr. Hill confirmed that the $25 million number was discussed, and said that his understanding was that the committee should try to reduce the budget gap by $25 million as soon as possible. He said that the larger goal was to make the budget sustainable for the next five years without raising taxes.

The conversation touched on the scope of the challenge; it was observed that the City is a complex organization. The background material distributed filled a four inch binder. Committee members will consider forming sub-committees at the next meeting.

Mr. Hill said that the committee must decide if there are services that the City should stop providing. The administration has asked department heads to list and prioritize the services their organizations currently oversee. Councilman Kennedy raised the possibility of identifying additional services that can be shared between the City and the School Board to achieve cost savings.

One budget item that Mr. Hill indicated was not up for debate was the General Fund allocation to education. He stated that the $284 million allocation that the City has made in recent years is a State mandated figure. He directed the committee to focus on the other $268 million in the $552 million General Fund budget.

The committee’s next meeting is expected to be on either 1/15 or 1/16, depending on committee member schedules.

—–

2015-01-09, 8:30am, Correction: An earlier version of this article identified Albert Ilg as the Acting Finance Director. Mr. Ilg is no longer in that role, which is currently held by Leigh Ann Ralls.

Hartford’s Long-Term Debt as of June 2013

As of June 30, 2013, the end of the City’s fiscal year, Hartford’s General Obligation debt included scheduled payments through the fiscal year ending in 2033.

2014-11-08 Debt Service Payments as of 2013-06-30

Hartford’s total debt was increased and restructured in the spring of 2013. The chart below compares the forward-looking debt service to the historical payments.

2014-11-08 Debt Profile as of 2013-06-30

The distribution of Hartford’s future debt service payments was modified during the 2013 debt restructuring. A spike in debt payments was scheduled to come due during the current decade; see the City’s debt profile as of June 2012 as a point of comparison. Some of those debts have been retired over the past few years. Much of the remaining obligation has been deferred to the decade of the 2020s.

Note that the Comprehensive Annual Financial Report for 2013 shows both the newly issued bonds and the bonds that were paid off early in the audited financial. This overstates the amount of debt the City owes by over $100 million, making the CAFR’s tables and exhibits very misleading. There is an accounting technicality involved that is explained in Note 8 on page 70 of the pdf.

2013 Debt Restructuring

In the spring of 2013, Hartford raised $140 million to restructure the City’s debt by issuing general obligation bonds.

The face value of the new issue was $124.6 million, and an additional $15.6 million was received as a premium from investors because the coupon rate was above market interest rates at the time. Net proceeds were used to pay off previously issued debt.

The chart below shows the scheduled general obligation bond payments beginning in fiscal 2014. The City’s debt profile as of June 30, 2012 is shown in green in the background. On top of that data series, the purple bars are the City’s new debt profile after the refinancing.

Columns with green tops represent reductions in scheduled debt service payments. Columns with purple tops represent increases in scheduled debt service payments.

2014-11-07 Refinance 2013

The effect of the restructuring was to delay maturities, extending the due date for a meaningful amount of the City’s general obligation debt well into the future.

Years 2014 through 2018 all have green column tops. The amount of green shows how much less Hartford owed in each year. For example, in 2014 the scheduled payment fell from about $38.5 million to about $21.3 million.

Years 2019 through 2032 all have purple column tops. The amount of purple shows how much more Hartford owed in each year. For example, in 2032 the scheduled payment rose from about $2.6 million to $12.7 million.

Issuing new bonds to pay off older bonds early is a common strategy for managing debt. It is especially effective when the interest rate of the debt can be lowered.

In this case, there was not a meaningful difference in interest rates. The coupon rates for all the bonds paid off early were 5.25% or below. The coupon rate for the majority of the new 2013 bonds issued was right at 5%.

Pushing the due date of debt into the future increased the amount of total interest owed. Hartford borrowed money for a longer period of time, therefore agreed to pay interest for a longer period of time.

The 2013 debt restructuring increased the cumulative interest owed from 2014 through 2032. Interest totaled about $101 million before the restructuring. After the restructuring, total interest grew to about $142 million.

City Press Releases
1. Moody’s And Standard & Poor’s Affirm City of Hartford’s Bond Ratings and Issue ‘Stable Outlook’
2. Hartford, CT to sell $240M of Debt