Tag Archives: Municipal Bonds

Hartford’s Taxable Debt

Municipal bonds are usually tax-exempt. This is an advantage for cities, as interest rates are lower on tax-exempt bonds.

The last two debt issues by the City of Hartford have included a portion of the overall borrowing that did not qualify for tax-exempt treatment, raising the overall cost of borrowing.

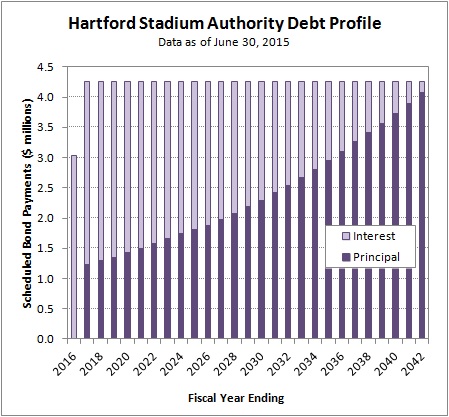
The Hartford Stadium Authority issued taxable bonds to fund the construction of the non-public portions of the ballpark. The City itself issued taxable bonds in the July 2015 restructuring used to balance the current year budget.

Treasurer Adam Cloud stated that the City’s debt can only be refunded once with tax-exempt bonds. Subsequent refundings (of the same debt) are required to be taxable.

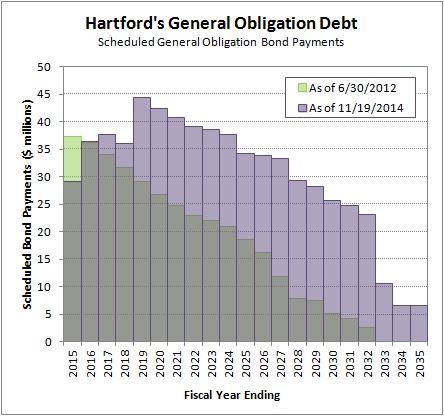
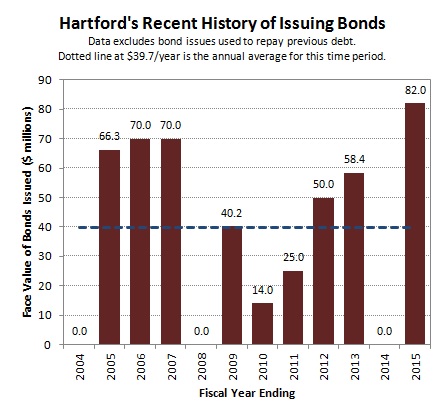
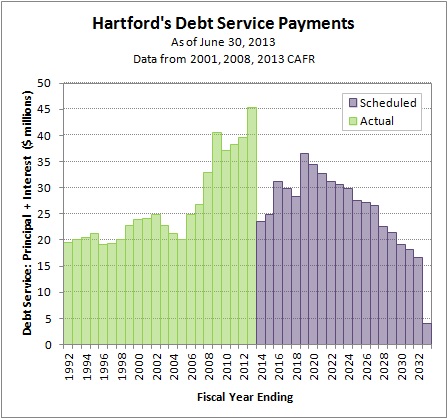
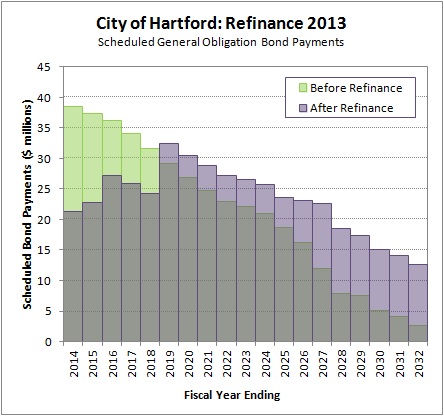
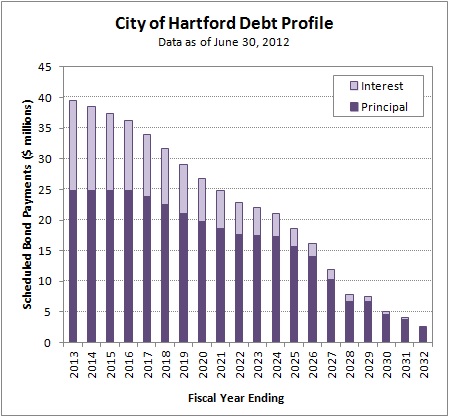
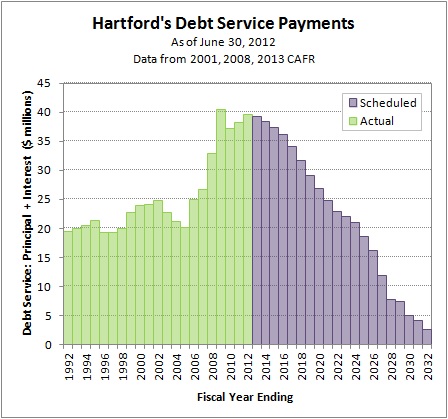
Hartford has refunded a lot of bonds in recent debt restructuring efforts. The total is $272.5 million in 6 issues since 2009, of which $240.8 million is outstanding. Refunding bonds represent over 58% of the City’s total outstanding debt. As a point of comparison, refunding bonds represented just 20% of the City’s outstanding debt as of June 30, 2012.

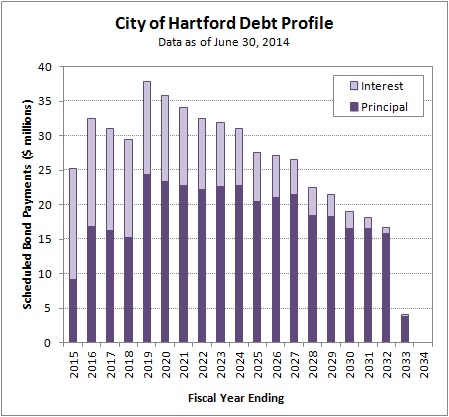
How do the maturities of the Refunding bonds compare to the Original issue bonds?

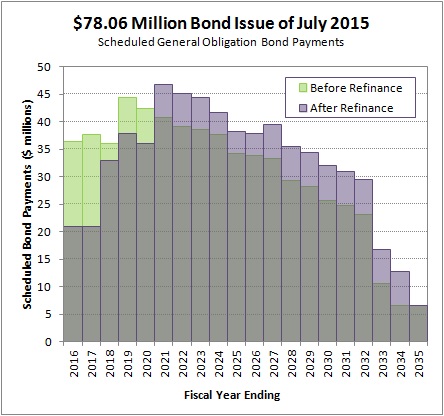
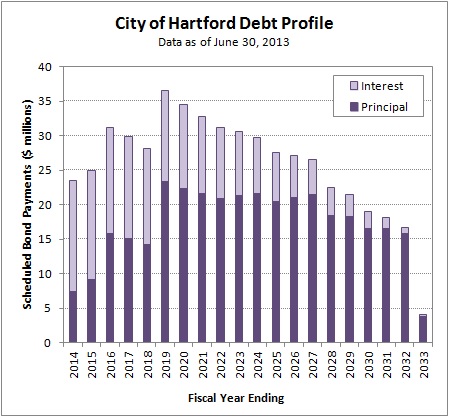
The City’s debt profile can be separated into refunding issues and original issues. In the chart below, the original issues are shown in blue on the bottom. Refunding issues are shown stacked on top in red. For both series, the darker portions of the bar represent scheduled principal payments and the lighter portion represents scheduled interest payments.

2015-07-23 July 15 2015 Original vs Refunding

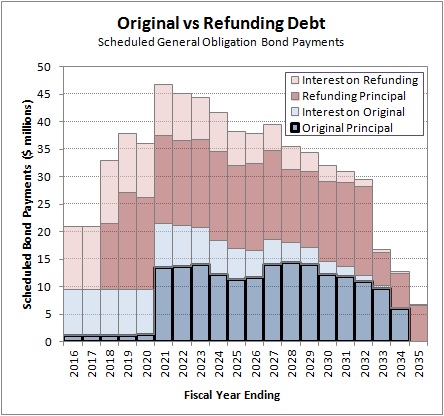
Each column represents the scheduled debt payment for a fiscal year. The dark blue section with the thick border at the bottom of each column represents the portion of that year’s obligation that could be restructured using tax-exempt debt.

There are virtually no original issue principal payments due through fiscal 2020 that could be restructured using tax-exempt debt.

It is important to note that scheduled interest payments can’t be restructured away. If interest rates are favorable, then interest payments can be reduced by refinancing to a lower rate. Both postponing principal payments into the future, and accepting higher interest rates, will cause near-term interest expenses to increase.

How much higher is the taxable interest rate?

The July 2015 issue included both taxable and tax-exempt bonds. Plotting the market interest rates from the Official Statement allows a rough yield curve to be drawn, comparing interest rates based on maturity and tax classification.

July 2015 Yield Curves

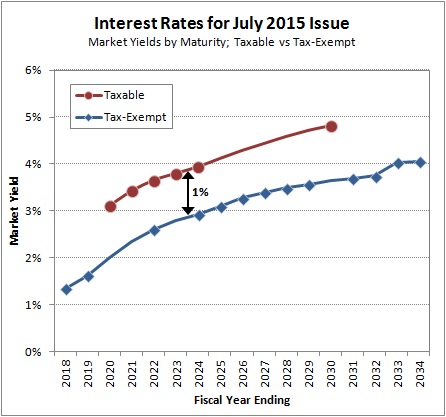
The market charged Hartford a 1.0% higher interest rate on the taxable debt than on the tax-exempt debt.

If Treasurer Cloud’s statement is accurate (and complete), then the sharp increase in refunded debt over the past 3 years has important implications.

The City has very little near-term debt that can be restructured with tax-exempt bonds. And the financial markets charge meaningfully higher interest rates for taxable bonds compared to tax-exempt bonds.

Future debt restructurings will be much more expensive for Hartford than they have been in the recent past.

July 2015 Debt Restructuring

The City of Hartford began the 2015-2016 fiscal year with a $78.06 million debt issue intended to help balance the current year budget by deferring payments.

The chart below compares the scheduled debt payments before and after the restructuring. The City’s projected debt profile as of June 30, 2015 is shown in the rear in green. On top of that series, the purple bars show the City’s new debt profile after the restructuring.

Columns with green tops represent reductions in scheduled debt service payments. Columns with purple tops represent increases in scheduled debt service payments.

2015-07-22 July 2015 Bond Issue

The primary goal of the restructuring was to dramatically lower debt service payments in fiscal 2016 and 2017. The Hartford Citizen model shows cash savings of over $15 million and $16 million for the two years, respectively. Cash savings are projected to be more modest in fiscal 2018 – 2020. Again, the green tops on the bars represent savings.

In exchange for reducing the near-term debt service, the City took on additional payments of between $4 million and $6 million in each year from 2021 through 2034. Those are the bars with purple tops in the chart. The change to 2035 was negligible, and no debt was added for fiscal 2036.

Note that the Hartford Stadium Authority’s debt has not been included in this calculation. The Stadium Authority is structured as a financial pass-through, where the City makes lease payments that exactly match the Authority’s debt payments. The City will be required to pay an additional $4.26 million per year in lease payments from 2017 through 2042.

$20.8 million of the $78 million in debt raised in July 2015 was issued as taxable bonds. When asked why the bonds didn’t qualify for tax-exempt status, City Treasurer Adam Cloud stated that IRS tax law only allows tax-exempt bonds to be refinanced one time with tax-exempt bonds. Further refinancings are required to be done with taxable debt.

The July 2015 debt restructuring provided the City of Hartford financial relief in fiscal 2016 and fiscal 2017. At the same time, it continued a recent trend of postponing debt, and highlighted an additional cost for future restructuring efforts.

Stadium Authority Debt

In October 2014, the Hartford City Council approved the construction of a minor league baseball stadium as part of the Downtown North redevelopment project. The Hartford Stadium Authority was created in January 2015 to oversee the facility, and was empowered to issue debt.

The Hartford Stadium Authority raised $63.4 million via two bond issues in February 2015 to fund construction. Taken together, the debt was structured to be repaid in annual installments of about $4.26 million until the City’s fiscal year that ends in June 2042.

2015-06-30 Hartford Stadium Authority Debt Profile

The debt is backed by a lease that the City of Hartford signed with the Stadium Authority. Scheduled rent payments, as shown in page 12 of the Official Statement, are intended to match up exactly with debt payments.

Two series of bonds were issued to fund construction because a portion of the costs did not qualify for the tax-exempt status that municipal governments usually receive. Tax-exempt bonds totaled $39.1 million in face value, and were issued at yields of between 1.23% and 4.15%. The remaining $23.4 million in face value was determined to be subject to federal taxes, and was issued at a yield of 5.625%.

When asked why a portion of the debt was issued as taxable, City Treasurer Adam Cloud explained that the public infrastructure created during stadium construction is tax-exempt. However certain things, like luxury boxes/suites, are private use and are required to be financed on a taxable basis.

Debt service on the stadium is structured as a fully amortizing loan. The City, via the Stadium Authority, will make equal payments every year until the construction costs have been repaid. Although the underlying bonds have a wide range of maturities and yields, the overall strategy is directly comparable to how individuals finance residential real estate purchases.

Converted to the terms of a fixed rate mortgage, the City borrowed $62.45 million, using a 27 year loan, with an interest rate of 5.0%.

Hartford Can’t Borrow its Way to a Balanced Budget

Hartford’s elected leaders restructured the City’s debt in March 2013 in an attempt to address a structural budget gap. It was an effective way to address short-term concerns, but will ultimately be an expensive temporary measure as the bill comes due.

The chart below attempts to show graphically how scheduled debt payments were manipulated. It compares scheduled payments as of June 30, 2012 (green bars in the background) to scheduled payments after the November 2014 issue (purple bars in the foreground).

The color at the top of the bar indicates the direction of the change. A green top means the scheduled payment was higher as of June 2012, while a purple top means the scheduled payment was higher as of November 2014.

2015-02-17 Evolution of the Hartford Debt Profile

The Hartford Citizen’s model estimated that Hartford owed about $29 million in the current fiscal year (fiscal 2015). This total is over $8 million less than the City was scheduled to owe as of June 2012. The decrease illustrates the impact of the restructuring.

While arguably an effective short-term strategy for balancing the budget, postponing debt into the future is a poor long-term strategy. The debt will ultimately need to be repaid, with interest.

If a balanced budget depends on annual debt service costs of about $29 million, then what will that mean for the future? Debt service payments are projected to remain above this year’s $29 million level until 2028. They are projected to peak at $44 million in 2019.

Since fiscal 2004, the City has averaged $39.4 million in new debt issued per year. It is highly unlikely that Hartford will stop issuing debt altogether in order to pay down the current balance.

The chart below shows the year-by-year totals, and excludes debt used to restructure or refinance. So far this year (fiscal 2015), Hartford has issued $82 million in debt, more than double the average of the 2004 to 2015 time period.

2015-02-17 Recent History of Bond Issues

When a person, or a company, or a municipality borrows money, they need to have a plan pay it back. Money is not free.

Borrowing money can delay expenses, but it cannot reduce them. Loans are not a long-term solution to a structural budget gap. Additional debt will make a persistent budget deficit worse.

How do the City’s elected officials plan to pay back the money Hartford already owes?

$36.4 Million Bond Issue of November 2014

Shortly after issuing $82 million of bonds in October of 2014, the City brought another round of debt to market in November of 2014.

Hartford raised $40.5 million total, with a face value of $36.4 million and premium of $4.1 million. The purpose of the issue was to refinance previous debt, and the Official Statement noted specifically which existing bonds would be refunded.

In a press release that accompanied the two late 2014 issues, Treasurer Adam Cloud stated that the November 2014 issue was “expected to produce approximately $2 million in debt service savings.”

The chart below shows the impact of refinancing on the scheduled debt payments. Unlike the April 2013 restructuring, the before data (green) and after data (purple) line up almost exactly. There was no obvious impact of the refinancing at the big picture level.

2015-02-16 November 2014 Bond Issue

The table below compares the annual maturities side by side. The approach of this refinancing was to substitute new bonds of approximately the same face value, but with different coupon interest rates. Green font in the table signifies new issues with a more favorable term; either a lower face value or a lower coupon rate. Red font signifies a less favorable term for the new issue.

2015-02-16 Maturities in the November 2014 Bond Issue

The impact of the refinancing is difficult to calculate with precision. There is subjectivity in how to treat debt payments that extend more than a decade into the future. Treasurer Cloud felt the offering would save the City “approximately $2 million” over 12 years.

The Hartford Citizen’s analysis of Hartford’s General Obligation debt was performed using a spreadsheet created to match the information shown in the annual audits (Comprehensive Annual Financial Reports). The model estimated total debt service savings of about $1.2 million over 12 years.

The estimate included the additional $485,000 in principal payments added to the debt, and summed future cash flows without discounting them (which maximized the value of future savings). The estimate did not include the $327,000 in underwriting fees paid to the investment bankers, which would bring the estimated savings below $1 million.

$82 Million Bond Issue of October 2014

Hartford raised two rounds of General Obligation debt in the fourth quarter of calendar 2014.

The first round was in October, when the City raised $95.1 million in an issue with $82 million in face value and $13.1 million in premium. According to the Official Statement, the proceeds were earmarked for “various public improvement projects” and “the City’s portion of various school projects.”

A press release issued by Treasurer Adam Cloud about the pair of bond offerings stated that the City received “its lowest borrowing cost in decades” at an effective interest rate of 3.11%.

The chart below compares the City’s scheduled annual debt payments (principal plus interest) before and after the debt issue. The green bars in the foreground show the debt profile as of June 30, 2014, while the purple bars in the background show the debt profile as of October 31, 2014.

2015-02-15 October 2014 Bond Issue

The purple tops of the bars show the amount of this issue to be repaid in each fiscal year. Payments were extended by two years, and about $6.5 million in annual debt service was added to fiscal years 2017 through 2035. If the bonds were held to maturity, the City would repay $130.8 million over 20 years.

Hartford’s Long-Term Debt as of June 2014

As of June 30, 2014, the end of the City’s fiscal year, Hartford’s General Obligation debt included scheduled payments through the fiscal year ending in 2033.

2015-02-14 Debt Profile as of 2014-06-30

There was no public debt issued by the City during the fiscal year that ended in June of 2014. However, the projected debt payments have changed since the June 30, 2013 long-term debt analysis.

The 2014 Comprehensive Annual Financial Report (CAFR) shows a $10.25 million debt issue from March 2013 on the table on page 65 of the pdf.

That issue was not included in the June 30, 2013 analysis because it was not included in the 2013 CAFR.

The table on page 70 of the 2013 CAFR shows the $124.6 million March 2013 issue that Hartford used to restructure City debt. The table does not show the $10.25 million March 2013 issue. In addition, there is no public offering statement available on the EMMA website.

Hartford Treasurer Adam Cloud stated that the $10.25 million issue was a private placement with Bank of America that did “not require an official statement” on the EMMA website, and that the funds were used for “various capital projects.”

Note that the Comprehensive Annual Financial Report for 2014 shows both the refunding bonds and the refunded bonds from the $124.6 million 2013 debt restructuring. This overstates the amount of debt the City owes by over $100 million, making some of the CAFR’s tables and exhibits misleading. There is an accounting technicality involved that is explained in Note 8 on page 64 of the pdf.

Hartford’s Long-Term Debt as of June 2013

As of June 30, 2013, the end of the City’s fiscal year, Hartford’s General Obligation debt included scheduled payments through the fiscal year ending in 2033.

2014-11-08 Debt Service Payments as of 2013-06-30

Hartford’s total debt was increased and restructured in the spring of 2013. The chart below compares the forward-looking debt service to the historical payments.

2014-11-08 Debt Profile as of 2013-06-30

The distribution of Hartford’s future debt service payments was modified during the 2013 debt restructuring. A spike in debt payments was scheduled to come due during the current decade; see the City’s debt profile as of June 2012 as a point of comparison. Some of those debts have been retired over the past few years. Much of the remaining obligation has been deferred to the decade of the 2020s.

Note that the Comprehensive Annual Financial Report for 2013 shows both the newly issued bonds and the bonds that were paid off early in the audited financial. This overstates the amount of debt the City owes by over $100 million, making the CAFR’s tables and exhibits very misleading. There is an accounting technicality involved that is explained in Note 8 on page 70 of the pdf.

2013 Debt Restructuring

In the spring of 2013, Hartford raised $140 million to restructure the City’s debt by issuing general obligation bonds.

The face value of the new issue was $124.6 million, and an additional $15.6 million was received as a premium from investors because the coupon rate was above market interest rates at the time. Net proceeds were used to pay off previously issued debt.

The chart below shows the scheduled general obligation bond payments beginning in fiscal 2014. The City’s debt profile as of June 30, 2012 is shown in green in the background. On top of that data series, the purple bars are the City’s new debt profile after the refinancing.

Columns with green tops represent reductions in scheduled debt service payments. Columns with purple tops represent increases in scheduled debt service payments.

2014-11-07 Refinance 2013

The effect of the restructuring was to delay maturities, extending the due date for a meaningful amount of the City’s general obligation debt well into the future.

Years 2014 through 2018 all have green column tops. The amount of green shows how much less Hartford owed in each year. For example, in 2014 the scheduled payment fell from about $38.5 million to about $21.3 million.

Years 2019 through 2032 all have purple column tops. The amount of purple shows how much more Hartford owed in each year. For example, in 2032 the scheduled payment rose from about $2.6 million to $12.7 million.

Issuing new bonds to pay off older bonds early is a common strategy for managing debt. It is especially effective when the interest rate of the debt can be lowered.

In this case, there was not a meaningful difference in interest rates. The coupon rates for all the bonds paid off early were 5.25% or below. The coupon rate for the majority of the new 2013 bonds issued was right at 5%.

Pushing the due date of debt into the future increased the amount of total interest owed. Hartford borrowed money for a longer period of time, therefore agreed to pay interest for a longer period of time.

The 2013 debt restructuring increased the cumulative interest owed from 2014 through 2032. Interest totaled about $101 million before the restructuring. After the restructuring, total interest grew to about $142 million.

City Press Releases
1. Moody’s And Standard & Poor’s Affirm City of Hartford’s Bond Ratings and Issue ‘Stable Outlook’
2. Hartford, CT to sell $240M of Debt

Hartford’s Long-Term Debt as of June 2012

Like an individual bond issue, the overall bonded debt of the City can be analyzed as a stream of future principal and interest payments. As of June 30, 2012 Hartford’s General Obligation debt included scheduled payments until the fiscal year ending in 2032.

2014-11-01 Debt Profile as of 2012-06-30

The City’s scheduled debt payments were highest in the near term and decreased over time. About $25 million in principal was due in each of 2013 through 2016. With interest, the payments began at almost $40 million.

According to data from the City’s Comprehensive Annual Financial Reports (2001, 2008, 2013), Hartford’s actual debt payments (principal + interest) were below $25 million per year through 2006.

2014-11-01 Debt Service Payments as of 2012-06-30

Annual debt service quickly climbed to over $35 million per year. As of June 30, 2012 it was projected to remain above $35 million through 2016, and above $20 million through 2024.

Note that the forward looking chart does not match the information reported in the 2012 Comprehensive Annual Financial Report exactly (Note 8 on the 68th page of the pdf). With that said, the calculation is close enough to useful. The most meaningful error is an approximately 2% overstatement of the interest payment due in 2013, making the total due in 2013 about 0.68% too high.