Category Archives: Reporting

Hartford’s Long-Term Debt as of June 2014

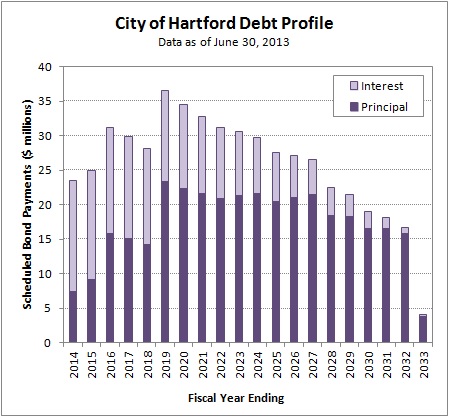
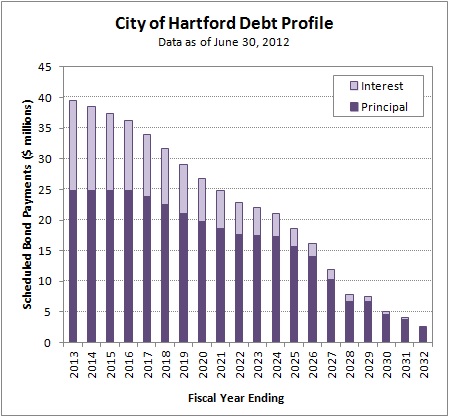
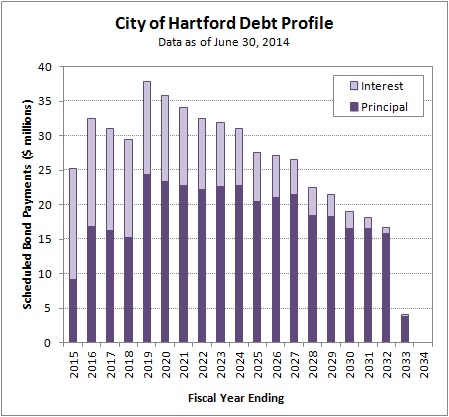
As of June 30, 2014, the end of the City’s fiscal year, Hartford’s General Obligation debt included scheduled payments through the fiscal year ending in 2033.

2015-02-14 Debt Profile as of 2014-06-30

There was no public debt issued by the City during the fiscal year that ended in June of 2014. However, the projected debt payments have changed since the June 30, 2013 long-term debt analysis.

The 2014 Comprehensive Annual Financial Report (CAFR) shows a $10.25 million debt issue from March 2013 on the table on page 65 of the pdf.

That issue was not included in the June 30, 2013 analysis because it was not included in the 2013 CAFR.

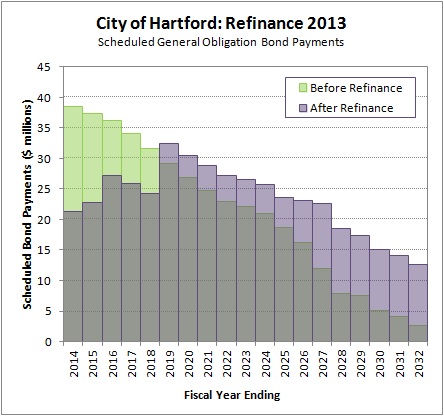
The table on page 70 of the 2013 CAFR shows the $124.6 million March 2013 issue that Hartford used to restructure City debt. The table does not show the $10.25 million March 2013 issue. In addition, there is no public offering statement available on the EMMA website.

Hartford Treasurer Adam Cloud stated that the $10.25 million issue was a private placement with Bank of America that did “not require an official statement” on the EMMA website, and that the funds were used for “various capital projects.”

Note that the Comprehensive Annual Financial Report for 2014 shows both the refunding bonds and the refunded bonds from the $124.6 million 2013 debt restructuring. This overstates the amount of debt the City owes by over $100 million, making some of the CAFR’s tables and exhibits misleading. There is an accounting technicality involved that is explained in Note 8 on page 64 of the pdf.

Distribution of Residential Real Estate Taxes

Property taxes fund a meaningful part of Hartford’s budget. The City has a split tax system in which residential real estate is taxed at a lower rate than other property types.

Specifically, single-family homes, two-family homes, three-family homes, condominiums, and a couple other smaller property classes are assessed at about 30% of Market Value (as of Grand List 2013). The State standard assessment ratio used by all other Connecticut municipalities, and used for other property classes within the City, is 70% of Market Value.

Taxes = (Market Value) * (Assessment Ratio) * (Mill Rate/1,000)

For the current fiscal year, which utilizes Grand List 2013, a residential property with a market value of $150,000 will owe about $3,335 in annual taxes. The effective tax rate is about 2.2% of market value.

The City Assessor’s office provided data for all the real estate that qualifies for the reduced residential assessment ratio for Grand List 2013. Using this list, the current assessment ratio of 29.93%, and the current mill rate of 74.29, the annual taxes were calculated.

The chart below shows how the annual residential properties taxes were distributed. For example, there were 6,608 properties that owed between $3,000 and $3,999, which is shown as the “$3,000s” in the chart.

2015-01-27 Residential Property Tax Distribution

There were 17,126 residential properties in the dataset. The average annual bill was about $3,240 and the median annual bill was about $3,182.

First Restructuring Committee Meeting

City of Hartford COO Darrell Hill convened the first meeting of the Hartford Committee on the Restructuring of City Government on the afternoon of Monday, January 5, 2015.

Nine of the twelve committee members attended at least a portion of the meeting. There appeared to be some membership changes since the initial appointments. The gathering focused on background information and the committee’s overall mission.

Mr. Hill noted that the Committee was originally expected to start in July of 2014 and deliver final recommendations in December 2014. He said that he still envisioned a six month effort, though recognized that major recommendations were unlikely to be approved in time for the City budget cycle that is about to begin.

Preliminary documents distributed to committee members estimated a $40.4 million budget gap for the coming fiscal year. Committee member Albert Ilg stated that he recalled a $25 million goal when the resolution establishing the committee was passed in the spring of 2014. Mr. Hill confirmed that the $25 million number was discussed, and said that his understanding was that the committee should try to reduce the budget gap by $25 million as soon as possible. He said that the larger goal was to make the budget sustainable for the next five years without raising taxes.

The conversation touched on the scope of the challenge; it was observed that the City is a complex organization. The background material distributed filled a four inch binder. Committee members will consider forming sub-committees at the next meeting.

Mr. Hill said that the committee must decide if there are services that the City should stop providing. The administration has asked department heads to list and prioritize the services their organizations currently oversee. Councilman Kennedy raised the possibility of identifying additional services that can be shared between the City and the School Board to achieve cost savings.

One budget item that Mr. Hill indicated was not up for debate was the General Fund allocation to education. He stated that the $284 million allocation that the City has made in recent years is a State mandated figure. He directed the committee to focus on the other $268 million in the $552 million General Fund budget.

The committee’s next meeting is expected to be on either 1/15 or 1/16, depending on committee member schedules.

—–

2015-01-09, 8:30am, Correction: An earlier version of this article identified Albert Ilg as the Acting Finance Director. Mr. Ilg is no longer in that role, which is currently held by Leigh Ann Ralls.

Hartford’s Long-Term Debt as of June 2013

As of June 30, 2013, the end of the City’s fiscal year, Hartford’s General Obligation debt included scheduled payments through the fiscal year ending in 2033.

2014-11-08 Debt Service Payments as of 2013-06-30

Hartford’s total debt was increased and restructured in the spring of 2013. The chart below compares the forward-looking debt service to the historical payments.

2014-11-08 Debt Profile as of 2013-06-30

The distribution of Hartford’s future debt service payments was modified during the 2013 debt restructuring. A spike in debt payments was scheduled to come due during the current decade; see the City’s debt profile as of June 2012 as a point of comparison. Some of those debts have been retired over the past few years. Much of the remaining obligation has been deferred to the decade of the 2020s.

Note that the Comprehensive Annual Financial Report for 2013 shows both the newly issued bonds and the bonds that were paid off early in the audited financial. This overstates the amount of debt the City owes by over $100 million, making the CAFR’s tables and exhibits very misleading. There is an accounting technicality involved that is explained in Note 8 on page 70 of the pdf.

2013 Debt Restructuring

In the spring of 2013, Hartford raised $140 million to restructure the City’s debt by issuing general obligation bonds.

The face value of the new issue was $124.6 million, and an additional $15.6 million was received as a premium from investors because the coupon rate was above market interest rates at the time. Net proceeds were used to pay off previously issued debt.

The chart below shows the scheduled general obligation bond payments beginning in fiscal 2014. The City’s debt profile as of June 30, 2012 is shown in green in the background. On top of that data series, the purple bars are the City’s new debt profile after the refinancing.

Columns with green tops represent reductions in scheduled debt service payments. Columns with purple tops represent increases in scheduled debt service payments.

2014-11-07 Refinance 2013

The effect of the restructuring was to delay maturities, extending the due date for a meaningful amount of the City’s general obligation debt well into the future.

Years 2014 through 2018 all have green column tops. The amount of green shows how much less Hartford owed in each year. For example, in 2014 the scheduled payment fell from about $38.5 million to about $21.3 million.

Years 2019 through 2032 all have purple column tops. The amount of purple shows how much more Hartford owed in each year. For example, in 2032 the scheduled payment rose from about $2.6 million to $12.7 million.

Issuing new bonds to pay off older bonds early is a common strategy for managing debt. It is especially effective when the interest rate of the debt can be lowered.

In this case, there was not a meaningful difference in interest rates. The coupon rates for all the bonds paid off early were 5.25% or below. The coupon rate for the majority of the new 2013 bonds issued was right at 5%.

Pushing the due date of debt into the future increased the amount of total interest owed. Hartford borrowed money for a longer period of time, therefore agreed to pay interest for a longer period of time.

The 2013 debt restructuring increased the cumulative interest owed from 2014 through 2032. Interest totaled about $101 million before the restructuring. After the restructuring, total interest grew to about $142 million.

City Press Releases
1. Moody’s And Standard & Poor’s Affirm City of Hartford’s Bond Ratings and Issue ‘Stable Outlook’
2. Hartford, CT to sell $240M of Debt

Hartford’s Long-Term Debt as of June 2012

Like an individual bond issue, the overall bonded debt of the City can be analyzed as a stream of future principal and interest payments. As of June 30, 2012 Hartford’s General Obligation debt included scheduled payments until the fiscal year ending in 2032.

2014-11-01 Debt Profile as of 2012-06-30

The City’s scheduled debt payments were highest in the near term and decreased over time. About $25 million in principal was due in each of 2013 through 2016. With interest, the payments began at almost $40 million.

According to data from the City’s Comprehensive Annual Financial Reports (2001, 2008, 2013), Hartford’s actual debt payments (principal + interest) were below $25 million per year through 2006.

2014-11-01 Debt Service Payments as of 2012-06-30

Annual debt service quickly climbed to over $35 million per year. As of June 30, 2012 it was projected to remain above $35 million through 2016, and above $20 million through 2024.

Note that the forward looking chart does not match the information reported in the 2012 Comprehensive Annual Financial Report exactly (Note 8 on the 68th page of the pdf). With that said, the calculation is close enough to useful. The most meaningful error is an approximately 2% overstatement of the interest payment due in 2013, making the total due in 2013 about 0.68% too high.

Example Bond Issue: April 2011

The basics of a Municipal Bond are straightforward. The City borrows some money, pays interest while using it, and then pays it all back on the due date.

The reality of the bond markets is more complicated. As an example, consider the Bond issue that Hartford did in April of 2011. The City issued $25,000,000 in debt in the first half of 2011.

Page 2 of the Offering Statement showed that the issue was actually a series of 13 bonds. The first 12 were scheduled to come due each April 1st beginning in 2013 and ending in 2024. The face value of those notes was relatively constant each year, and the coupon rate varied between 3.00% and 5.25%.

The final bond was written to be due on April 1, 2031 with a face value of approximately 7 times as high as the others. The final bond also included a mandatory sinking fund provision that forced the principal to be paid off in 7 equal annual installments on April 1 of 2025 through 2031.

Each bond is an individual financial security, with it’s own unique ID called a CUSIP Number. Each bond can be bought and sold independently of the others in the series.

2014-10-31 April 2011 GO Bond Series

Because the coupon rate for most of the individual bonds in the series was above the market interest rate at the time (yield), the proceeds from the overall issue was higher that the $25,000,000 face value of the debt. The proposed Sources and Uses table on page 10 of the Offering Statement (numbered as page 8 in the document) shows that the proceeds totaled $25,609,052.

One way to understand the debt issue is to plot the annual principal and interest due on the series of bonds. Interest is highest in the early years, because interest is due on all of the individual bonds in the series. As time goes on, some of the bonds come due and the City pays off the principal. Paying down the principal causes the annual interest to fall.

2014-10-31 April 2011 Payment Summary

Note that the annual principal payments remain constant throughout because of the mandatory sinking fund provision placed on the bond due in April of 2031.

Principal repayment for the $25,000,000 in debt was to be paid off in roughly equal installments over 19 years.

Intro to Municipal Bonds

Cities and Towns typically do not have enough cash available to pay for large expenses, so they borrow money. Municipal Bonds are the most common way in which the borrowing is structured.

A bond is a type of contract between two parties that specifies legal and financial terms for lending. In this case, the City of Hartford is asking to borrow money and offering to pay it back in the future.

It is traditional in the bond market for the borrower to receive all of the money up front. The borrower then pays interest twice per year at a fixed interest rate for the life of the bond. At some point in the future, when the bond is due, the borrower pays back the entire amount of the bond.

Suppose Hartford borrowed $1,000,000 at 5% for 10 years. The City would receive the $1,000,000 when the deal closed. Every six months, the City would make a “coupon payment” of half of the annual interest:

$1,000,000 * 5% * 1/2 = $25,000

In 10 years, when the bond is due, the City would pay $1,025,000 to cover the final interest payment and the full face value of the note.

Municipal Bonds are a special type of debt contract. Government entities are allowed to issue debt in which the interest income (the coupon payment) is exempt from income taxes.

The effect of this policy is to lower the interest rate for municipal bonds below that of corporate bonds. Municipalities, and therefore their taxpayers, save money by taking advantage of the lower cost of borrowing.

PILOT in Hartford

Data from the CT.gov Open Data Website shows that Hartford was the second largest recipient of Payment in Lieu of Taxes (PILOT) funding in the State for the fiscal year ending in June of 2014.

2014-10-29 Top PILOT Recipients

Within the City of Hartford, the market value of tax exempt property eligible for PILOT funding totaled about $2.6 billion during that fiscal year. As a point of comparison, this was slightly higher than the market value of all the Residential property.

Property tax rates in Hartford vary by property type due to the split assessment ratio. The effective “tax rate” of the PILOT program can be calculated and compared to the other property classes.

The chart below shows that the State paid a lower tax rate than even the heavily protected Residential property owners. Data for the taxable property classes came from a handout given to the 2013-2014 Tax Task Force.

2014-10-29 PILOT Tax Rate

Payment in Lieu of Taxes by the State

The State of Connecticut has created a program to help address the loss of property tax revenue that municipalities experience due to certain types of tax-exempt property. The program is called Payment in Lieu of Taxes (PILOT).

PILOT reimburses cities and towns a percentage of a qualifying property’s potential tax liability. There are two portions of the program. One portion covers State Owned property. It specifies that prison facilities are reimbursed at 100% of the tax rate, and all other qualified state owned property are reimbursed at 45%. The other portion covers Private Colleges and Hospitals, which are reimbursed at 77% of the tax rate.

Sections 12-19a and 12-20a of the Connecticut General Statutes, which define the PILOT program, appear to have been created in the 1970s. There have been numerous changes to each section over the years, including what is covered and the formula used to calculate the grants.

Information from the Open Connecticut Data website shows that the overall PILOT program has been about a $200 million line item for the State over the past 10 years.

2014-10-10 PILOT Funding History

However, the PILOT program is not fully funded. The municipalities that request reimbursement only receive about half of the amount they request according to the Department of Operations, Policy and Management.

2014-10-10 PILOT Funding Rate History

The reimbursement percentage that each municipality receives varies based on their mix of qualifying property types.

To illustrate the calculation, consider a hypothetical town that has one qualifying State Owned building. The town’s Assessor would value the property and calculate a tax bill for the parcel. Since it’s a general State Owned building, it would qualify for the PILOT program at a 45% reimbursement rate. The State Legislature has funded the PILOT program for State Owned buildings at 53.4% in the current fiscal year. The town would receive a grant for 45% * 53.4% = 24.0% of the tax bill for that property.

The program pages on the State website notes that 169 municipalities and 5 boroughs receive grants for State Owned property, while 59 towns and 14 taxing districts receive grants for Colleges and Hospitals.